Data Science, Data Visualization, Jupyter Notebook

Jupyter Notebook, matplotlib figure display options, and pandas.set_option() optimization tips.

I prefer to do my coding in a Jupyter Notebook, as my previous posts have mentioned.  However, I have not run across any good documentation on how to optimize the notebook, for either a python or R kernel.  I am going to mention a few helpful hints I have found.  Here is the link to the Project Jupyter site.

First a basic comment on how to create a notebook where you want it.   You need to navigate to the directory where you want the notebook to be created.  I use the Windows PowerShell command-line shell.  When you open it up, you are at your home directory.  Use the “dir” command to see what is in that directory, and then use the “cd” (change directory) command to navigate to the directory you want to end up in.  If it is a longer path, you should enclose in quotes.  If you need to create a new directory, use the “md” or “mkdir” command to create a new directory.  For example, my long path is –  “….\Jupyter Notebooks\Python Notebooks”, and while at SciPy 2016 I created an new folder, and this directory is “….\Jupyter Notebooks\Python Notebooks\SciPy16” – to which I added a folder for each tutorial I attended.

Once you get into the final directory, type “Jupyter Notebook”, and a new notebook will be opened.  The first page that opens up is the “Home” page, and if your notebook exists, you can select it here.  If it doesn’t yet exist, then select “New” if the upper right, select your notebook type (for me R or Python 3), and it will launch the notebook.  (This notebook is from a pandas tutorial I attended at SciPy 2016 – “Analyzing and Manipulating Data with Pandas by Jonathon Rocher (excellent presentation if want to watch the video being created).

2016-07-14_15-48-13

Once you click on the “pandas_tutorial”, this Jupyter notebook will open up.

2016-07-14_15-50-47

A nice feature is that if you clone GitHub repository into that folder, and start a new Jupyter Notebook, then all the files that go with that repository are immediately available for use.

Importing data in a Jupyter Notebook.

If you are tired of hunting down the path for a data set, there is an easy way to find a data set and get it into the directory of the Jupyter notebook.  Go to the “Home” page, and select “Upload” and you will be taken to the “file upload” application.  Navigate to where you stored the data set on your computer, select, and then it will load that onto the home page.  You can then easily load it into your specific Jupyter notebook that is associated with that directory.

2016-07-14_15-48-13

Matplotlib figure display options.

If you don’t specify how to display your figures in the Jupyter notebook, when you create a figure using matplotlib, a separate window will open and display the graph.  This window is nice because it is interactive, and you can zoom in on the graph, save it, put labels in, etc.  There is a way to do this in the Jupyter notebook.

The first option I learned about was:

%matplotlib inline

This would display the graph in the notebook, but it was no longer interactive.

However, if you use:

%matplotlib notebook

The figures will now show up in the notebook , and still be interactive.  I learned this during the pandas tutorial at SciPy 2016.

You can also set your figure size by:

LARGE_FIGSIZE = (12,8) # for example


Some pandas optimization hints

Use:

pandas.set_option()

to set a large number of options.  For example:

pandas.set_option(“display.max_rows”, 16)

and only 16 rows of data will be displayed.  There are many options, so just use “pandas.set_option?” command to see what is available.

If you have other useful Jupyter notebook tips, would love to hear about them.


Data Science, Data Visualization

Altair – A Declarative Statistical Visualization Library for Python – Unveiled at SciPy 2016 Keynote Speech by Brain Granger.

You should check out Altair, an API designed to make data visualization much easier in Python.  Altair was introduced today during a keynote speech by Brian Granger during the opening day of SciPy 2016 (Scientific Computing with Python). Brian is the leader of the IPython project and co-founder of Project Jupyter (Jupyter notebooks are my favorite way to code in Python or R).

Matplotlib has been the cornerstone of data visualization in Python, and as Brian Granger pointed out, you can do anything you want to in matplotlib, but there is a price to pay for that, and that is time and effort.

Altair is designed as “a declarative statistical visualization library for Python”.  Here is the link to Brian Granger’s GitHub site which houses the Altair files.  Altair is designed to be a very simple API, with minimal coding required to produce really nice visualizations.  A point Brian made in his talk was that Altair is a declarative API, which specifies what should be done, but not how it should be done.  The source of the data is a pandas DataFrame, that is in a “tidy format”.  The end result is a JSON data structure that follows the Vega-Lite specifications.

Here is my understanding of this relationship from a very high level Altair to Vega-Lite to Vega to D3.  (For more information, follow this link)  D3 (Data-Driven Documents) is a web-based visualization tool, but this is a low-level system.  Vega is designed as a higher-level visualization specification language built on top of D3.  Vega-Lite is a high-level visualization grammar, and a higher level language than Vega.  It provides a concise JSON syntax, which can be compiled to Vega specifications (link).  Altair is an even higher-level, and emits JSON data structures following the Vega-Lite specifications.   The idea is that as you get higher up, the complexity and difficulty of producing a graphic goes down.

On the GitHub site there are a number of Jupyter notebook tutorials.  There is a somewhat restricted library of data visualizations available, and they currently list scatter charts, bar charts, line charts, area charts, layered charts, and grouped regression charts.

The fundamental object in Altair is the “Chart”, which takes a pandas dataframe as a single argument.  You then start specifying what you want: what kind of “mark” and visual encodings ( X,Y, Color, Opacity, Shape, Size, etc.) you want.  There are a variety of data transformations available, such as aggregation, values, count, valid, missing, distinct, sum, average, variance, stdev, median, min, max, etc.  It is also easy to export the charts and publish them on web as Vega-Lite plots.

This looks like a very exciting and much easier to use data visualization API, and I look forward to exploring it more soon.

Data Science

Udemy.com has great courses for learning Python, R, Data Science.

Just a quick blog post to highlight the numerous courses available on Udemy.com.  I just completed Data Analysis in Python with Pandas, and found it very informative, especially with some of the advanced functions in DataFrames.

It is worthwhile keeping an eye on this site, because they have intermittent sales where these courses are deeply discounted.  I currently have 35 courses that cover Python, R, Data Science, MongoDB, SQL, MapReduce, Hadoop, teaching kids to code, Machine Learning, Data Vis, Time Series Analysis, Linear Modeling, Graphs, Rattle, Linear Regression, Statistics, Simulation, Monte Carlo Methods, Multivariate Analysis, Bayesian Computational Analyses, and more, most of which were purchased during these sales.

These are great course to learn the  underlying languages and concepts and to brush up when you have not used them for awhile.

I highly recommend these courses, just wish I had time to do more of them.


Becoming a Healthcare Data Scientist, Data Science, Data Scientist, Data Visualization, Northwestern University MSPA, Predictive Analytics

Northwestern University MSPA 402, Intro to Predictive Analytics Review

Summing this course up in one word = WOW.  This course should be taken early on because it is extremely motivating, and will help motivate  you to get through the other beginning courses such as Math for Modelers and Stats.  This course is a high level overview of why and how analytics should be performed.  It describes not only predictive analytics but the whole analytics spectrum and what it means to be an “analytical competitor”.  While you do not perform any actual analytics, you will understand why getting good at this is so important.

I took this course from Dr. Gordon Swartz, and highly recommend him.  Interestingly, he has bachelor degrees in nuclear engineering and political science from MIT, an  MBA from Northeastern University and a doctorate in business administration from Harvard.  His sync sessions were very informative and practical, and he provided on-going commentary in the discussion boards.

The course description is –  “This course introduces the field of predictive analytics, which combines business strategy, information technology, and modeling methods. The course reviews the benefits and opportunities of data science, organizational and implementation issues, ethical, regulatory, and compliance issues. It discusses business problems and solutions regarding traditional and contemporary data management systems and the selection of appropriate tools for data collection and analysis. It reviews approaches to business research, sampling, and survey design.”

The course is structured around required textbook reading, assigned articles, assigned videos, weekly discussions, one movie (Moneyball) and 4 projects.

Readings

The reading requirements are daunting, but doable.  You will (should) read 6 books in 10 weeks – a total of 1,590 pages.  There are 14 articles to read.  Each week has a short video as well.

These are the assigned books.  At first glance, this list will not seem to be a little odd with seemingly unrelated books.  However, they all help create the overall picture of analytics, and are all valuable.  I will provide just a brief overview of each, and plan to post more in-depth reviews of them later this summer.

Davenport TH, Harris JG.  2007. Competing on Analytics:  The New Science of Winning.  Boston Massachusetts: Harvard Business School Publishing.

This is the first text you read, for good reason.  It provides the backbone for the course.  You will learn about what it means to be an analytical competitor, how to evaluate an organizations analytical maturity, and then how to build an analytical capability.

Siegel E.  2013.  Predictive Analytics: The Power to Predict Who Will Click, Buy, Lie or Die.  Hoboken New Jersey: John H Wiley and Sons, Inc.

This is a must read for anyone going into predictive analytics, by one of the pioneers of this field.  It describes in detail what predictive analytics is, and gives numerous real life examples of organizations using these predictive models.

Few S.  2013.  Information Dashboard Design: Displaying data for at-a-glance monitoring.  Burlingame California: Analytics Press.

I will admit that when I first got this book I was very confused about why it was being included in a course on predictive analytics.  However, this turned out to be one of the best reads of the course.  For anyone who is in analytics and has to display information, especially in a dashboard format,  this is a must read.  This describes what dashboards are really for, and the science behind creating effective dashboards.  You will never look at a dashboard the same way in the future, and you will be critical of most commercially developed dashboards, as they are more about displaying flashiness and fancy bells and whistles rather than the functional display of pertinent data in the most effective format.  I can’t say enough good things about this book, a classic.

Laursen GHN, Thorlund J.  2010.  Business Analytics for Managers: Taking Business Intelligence Beyond Reporting.  Hoboken New Jersey: John H Wiley and Sons, Inc.

This is a great overview of business analytics.  This is especially valuable in it’s explanation of how the analytics needs to support the strategy of the organization.

Franks B.  2012.  Taming the Big Data Tidal Wave: Finding opportunities in huge data streams with advanced analytics.  Hoboken New Jersey: John H Wiley and Sons, Inc.

This was an  optional read, but I recommend reading it.  It is written in a very understandable way, and provides a great overview of the big data analytics ecosystem.

Groves RM, Fowler FJ, Couper MP, Lepkowski JM, Singer E, Tourangeau R.  2009.  Survey Methodology.  Hoboken New Jersey: John H Wiley and Sons, Inc.

I will admit this was my least favorite book, but having said that, I learned a ton from it.  For anyone who will even think about using survey’s to collect data, this is a must read. However the 419 pages make this a chore.  It would be nice to have an abridged version.  What it does, though, is wake  you up to how complex the process of creating, deploying, and analyzing surveys is.  I grudgingly admit this was a valuable read.

Articles

There are some really great articles included in the reading list.

Videos

There are videos that were developed by another professor that review the weeks material.  I did not find these especially helpful, but they did provide an overview of the weeks information, and might be  helpful if you are having some trouble understanding the material.

Weekly Discussions

Again, the weekly discussion are where it happens.  There are one or more topics that are posted.  There are usually some really great comments posted, and you can gain a lot of insight if you actually think about what you are posting, and what other people have posted.  If you post on the last day a brief paragraph, then you are missing out on some valuable information.

Moneyball

The first course I have taken where a movie was required.  There are discussions around this movie and one of the assignments involves creating an analysis of the Oakland A’s and how they used analytics.  I enjoyed the movie and thinking about this.

Assignments

There are four assignments where you must create a paper of varying lengths.  You must create this using the appropriate APA format, so it is useful for refining these skills.

I found these to be challenging, fun, motivating, and extremely enlightening.  These called for the application of what we learned to some real world situations.  For one of these, I performed an in-depth analysis of our organizations analytics which involved interviewing our senior leadership.  As a result of these interviews, it really started the process of moving our organization to the next analytical maturity level in a very meaningful way.

Another project involved the creation of a draft dashboard using the best practices outlined by Stephen Few in his text.  This was a great learning experience for me, and one that will translate into much better dashboards at our organization.

The last project involved creating a meaningful and valid survey.  This was informative as well, and I actually might send out my survey.

Summary

Overall, this was a fantastic course.  This will make it clear why we need to do this well, and what doing this well looks like.  After this, the actual work of understanding and developing predictive models begins.  Again, I feel as if got my money’s worth (not an easy thing to say since these courses are pricey!).

Summer Activities

I am taking the summer off and am trying to catch up on the projects that have been piling up.  For fun I am learning SQL (great book – Head First SQL by Lynn Beighley) and working my way through several Python Udemy courses.  I will be attending the SciPy 2016 Conference in Austin Texas in July as well, and am super excited about this. I will be going to tutorials on Network Science, Data Science is software, Time Series analysis and Pandas. If you are attending, give me a shout out.


Data Science, Northwestern University MSPA, Predictive Analytics

Northwestern University MSPA 401, Introduction to Statistics Review

I finished this course last week, and thought I would post my thoughts before I forget them.

I was in Professor Roy Sanford’s section, and I HIGHLY recommend him.  He is an extremely experienced practitioner, and very knowledgeable of statistics and in using R for statistical analysis.

The course is focused on several aspects – learning basic statistics, learning R to perform statistical analysis, and engaging the students to participate in discussions that are pertinent to the material being learned.

Learning Statistics

The core text for the course is Ken Black’s Business Statistics For Contemporary Decision Making, 8th Edition.  It is a loose leaf binder text so you can remove the sections you are studying, which makes it nice.  It is a very down to earth text, with plenty of examples and problems.  Their is a companion website called WileyPlus that has videos to watch and a variety of problems/exercises.

A second supplemental statistical text is Rand R. Wilcox’s Basic Statistics: Understanding Conventional Methods and Modern Insights.  There are selected readings which highlight some contemporary issues.  Not as easy to read as Black’s text, but still informative.

Learning R

The coursework is presented using R.  You don’t HAVE to learn to use R, but you would be an idiot not to take advantage of this opportunity.  There is a great deal of effort putting into devising the curriculum to help you learn R.   This is well thought out, and I feel very confident that I have obtained a good working knowledge of R on which to build.  I was astounded to read a comment on the LinkedIn group – Networking Group for Northwestern University’s MS in Predictive Analytics Program –  from a previous student who took this course, who commented he didn’t really learn any R because he didn’t do any of the R reading or assignments.  To me, learning R was just as important as learning the statistics.  Plus I don’t know how you could do the Data Analysis Projects without learning R. Learning R is accomplished through reading various text’s, watching weekly video’s on R produced by Prof. Sanford, and then doing exercises.  Plus there are R resources and lessons, including links to Lynda.com.

I did the work in both RStudio and in a Jupyter Notebook using the R kernel. The Jupyter Notebook was my favorite way of doing the assignments because I could refer back to them.  But some things are way easier to do in RStudio, like installing packages and data sets, so sometimes I switched between the two.  See my other blog posts for information about Jupyter Notebooks.

The first R text is Winston Chang’s R Graphics Cookbook.  This takes you through the R basics and gets you up to speed quickly visualizing data.  There is a little bit about using the base plotting function in R, but most of the book is about visualizing using the ggplot2 package.  If you follow the exercises, you will get good at plotting and visualizing data.  You will learn scatter plots, line graphs, bar graphs, histograms, box plots (a lot – I finally understand what to do with a box plot), functions, QQ plots (I finally understand these as well).  All of these are extremely helpful in what you will spend a lot of time learning, Exploratory Data Analysis (EDA).

The second R text is Jared P. Lander’s R for Everyone: Advanced Analytics and Graphics.  This dives more deeply into using R for things other than data visualization and graphics, although it includes this as well.  This is a very easy to read and follow text.

The third R text is John Verzani’s Using R for Introductory Statistics: 2nd Edition.  This book is a very deep dive into R’s capability to do statistical analysis.  Although very detailed, it is understandable with great examples.

The last R text is downloadable from the site, Sarah Stowell’s Using R for Statistics.  This is also a very practical book on both statistics and visualization.

Don’t be overwhelmed by the number of text’s and reading, it is doable, and I would do it all.  If you do that, you will not be able to say you did not get your money’s worth.

In addition there are beginning videos and lessons about learning R, including links to Lynda.com.   There are weekly Calculations with R assignment, which include a video with examples.  There are exercises with these weekly assignments as well.  Finally there are R lessons which take you through learning R in an organized manner.

Sync Sessions and Videos

Professor Sanford holds a sync session every other week.  These are extremely informative and helpful.  You don’t have to watch live, but you need to watch later.  The sync sessions in Predict 400 were optional and you could get by fine without watching them.  Not the case here.  You will learn a lot from these.

The same holds for the videos he has created to go along with the weekly R exercises.  These are must watch videos.

Data Analysis Projects

There are two data analysis projects.  You will learn how to apply what you are learning to a hypothetical data analysis project.  These are pretty challenging, but VERY worthwhile.  These show the applied focus of the MSPA program, and I found them beneficial.  The first one really focused on doing some exploratory data analysis.  The second one was twice as long as the first, and you applied what you learned later in the course, including the creation of a linear regression model.  You will definitely want to start early on these, and put in the effort to do these correctly, as together they constitute 2/5’s of your grade.

Bi-weekly Tests

There are 4 bi-weekly tests which are very fair and doable.  Together they constitute 1/5 of your grade.

Final Exam

The final exam is also very fair and doable.  Much easier if you have paid attention to learning R, as you can use R to do the exam.  This is 1/5 of your grade.

Communications and Discussions

There are Communications discussion sections set up for statistics and R.  You can post a question anytime in either and get a rapid response from either Prof. Sandford or the R TA.  Our R TA was Todd Peterson, and he was extremely knowledgeable, helpful, and responsive.

Every week there are two discussions around topics you are learning.  These are student driven, and if taken seriously, you can learn a lot from each other.  There are some extremely bright and talented students in these classes who have great real world experience in a variety of sectors.   The final discussion section is a recap of what you learned that week, and Prof. Sanford participates in that discussion.

Overall

I spent between 20-30 hours per week doing the coursework.  You wouldn’t have to spend that much time, especially if this material is not new for you.  But I wanted to really learn the material, not just pass the class.

I really enjoyed this course on many fronts.  I found learning about statistics and R together was very complementary.  In fact, I cannot imagine doing any kind of statistical analysis without using a language such as R.  I am now trying to recreate what I learned in R using Python.  I really feel as if I got my money’s worth.


Data Science, Data Visualization

Data Science Skill Network Visualization

I came across this great visualization by Ferris Jumah (see link Ferris Jumah’s blog post) about the relationships between data science skills listed by “Data Scientists” on their LinkedIn profiles.

data science skill networkbor55data science skill network
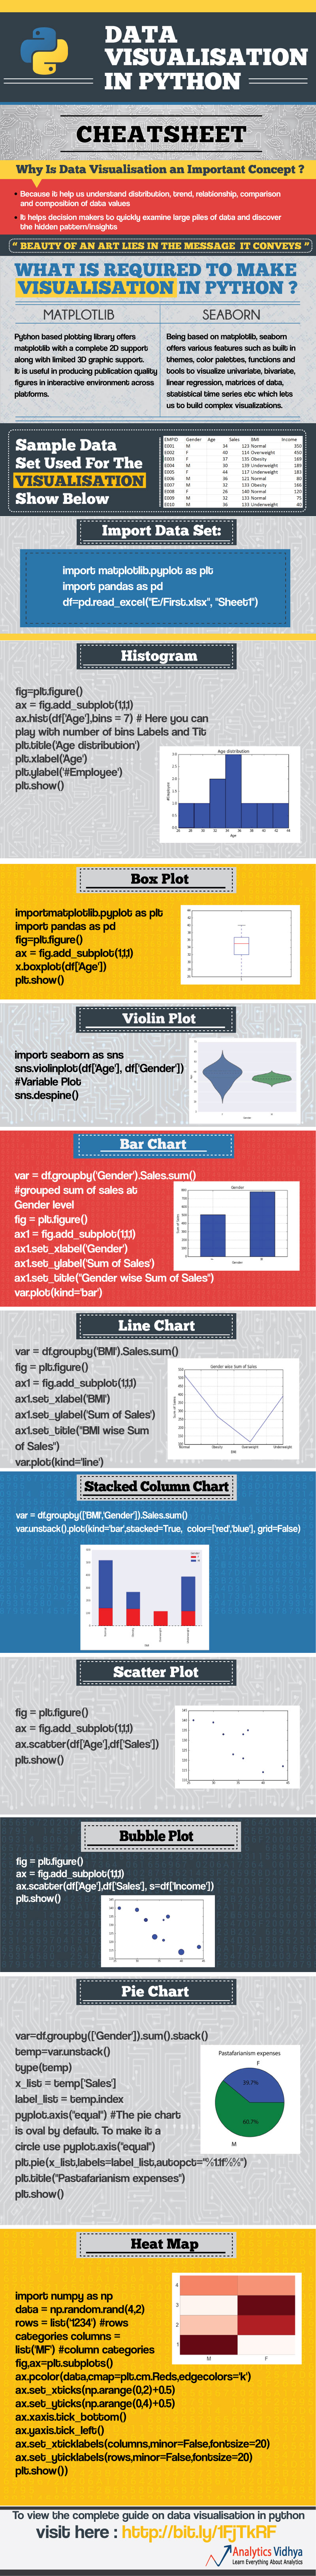
To view a higher resolution image go to: http://imgur.com/hoyFT4t

How many of these skills have you mastered?

Ferris’s conclusions about a few key themes:

  1.  Approach data with a mathematical mindset.
  2. Use a common language to access, explore and model data.
  3. Develop strong computer science and software engineering backgrounds.